NOTE: The Dashboard functionality was merged into Homepages in v16.8. Please look at the Homepage help article if you are using v16.8+.
Dashboard is an easy-to-use tool for creating Dashboards with graphs to present Satuit data. Graphs are built from Saved View data. Graphs can be saved as public or private. Once the graphs have been created, they can be configured into Dashboards which can then be published to other users.
Dashboard Overview ⏯
Create A Dashboard
- Click on the Dashboard icon from the navigation menu
- Click on the Customize icon from the upper right corner
- Next, select the Manage Dashboards icon
- Select the Add icon to begin creating a new dashboard
- Next, enter the Dashboard Name, Description, select a layout and click OK
- Click the Select A Chart icon, then select Add Chart or Use Existing
- ‘Add Chart’ allows you to create a new chart and then add the chart to the selected dashboard panel. The steps for creating a new chart are described in the ‘Creating a Chart’ section above
- ‘Use Existing’ allows for the user to select a chart that has already been created and add to the selected dashboard panel. When clicked on a window pops up with a list of charts that the user can select
Filter A Dashboard
Users can save filters on the dashboards for future use, allowing a single ‘master list’ to be used for multiple dashboard charts, meaning you do not need to create multiple versions of a saved view. This feature will create a new chart with a filter attached, leaving the original chart’s name and selection criteria untouched.
Create A Chart
After creating a chart, you can display them on your Home Page if your organization is running v16.0+ of Satuit.
- On the Dashboard tool, select the Customize icon from the upper right-hand corner. Users with view-only permission will not see this option
- Click on Manage Charts, then click Add to begin creating the chart
- From the Add New chart window, select the type of chart, select your saved view, and click Next
- Within the Add New Chart window, add the following details:
- Title: Text entered here will display above the chart
- Description: Text entered here will be displayed on the Manage Charts window
- Scope: It can be private or public
- Chart Style: Select the chart type for the graph
- Y-Value: Choose a field from the list of available fields that are pulled in from the saved view
- Calculation: Select a calculation method (Average, Count, Sum)
- X-Value: Choose a field from the list of available fields that are pulled in from the saved view
- Add Target Line: Enter a value for the target line to be added onto the graph
- Use the Preview button to preview your chart before clicking OK to review
- After you have reviewed your changes, click the Save icon from the Customize window
Manage Charts
Click the 'Manage Charts' button in the Customize window to Add, Edit, or Delete existing charts. If a chart has been edited and is being used in a dashboard, then for the changes to reflect it has to be added to the dashboard again. If a chart has been deleted and it is being used in a dashboard, then the user can continue using the chart in the dashboard.
View-Only User Features
View-Only users can do the following on Dashboards:
- Set a dashboard as default: Select the ‘Set as Default’ option
- Rename a dashboard: Select ‘Rename Dashboard’, enter a name, and then click ‘OK’
- Delete a dashboard: Select ‘Delete Dashboard’ and a message pops up saying ‘Are you sure you want to delete this dashboard?’ Click ‘OK’
Note
Deleting a default dashboard pops up a message saying ‘The default dashboard cannot be deleted. You must select another dashboard as a default before deleting’.
View-Only users can also Drill Down to view the records and Filter on the results.
Working With Dashboard
- View Data - Click the ‘Show Data’ button from the dashboard to see the underlying data that the graph represents. The Saved View data will be displayed below the graph where the show data button has been selected. Click on any record on the saved view to drill down and view the record detail page. Users can edit the record and upon saving if the edited field is used in the chart, then it reflects on the chart. To return to the full dashboard, click Show Dashboard
- Filter on a Saved View - Click the ‘Show Data’ button on the dashboard, then click on ‘Filter’ and enter text in any column and notice that the chart displays the filtered data
- Export Charts - To export a chart, click the Export icon in the upper right-hand corner of a chart panel
Publish A Dashboard
Only users with Admin rights will have access to the Publish Options icon on the Manage Dashboards window.
- Click on the Customize icon from the upper right-hand corner
- Next, select the Manage Dashboards icon
- Select the Dashboard that you want to publish to other users
- Next, click the Publish icon under the ‘Publish Options’ dropdown
- Select the Rep(s) to publish to, choose whether to send an email notification or not, then click OK
- If the ‘Notify Reps via Email’ is selected, then the Rep(s) get an email notification when the dashboard is published
A ‘New’ icon is displayed next to the published dashboard name in the list of dashboards for any Rep you published to. The ‘New’ icon is removed after the user clicks on the dashboard to view it for the first time.
The published dashboard is a copy of the original dashboard. Users can rename or delete the published dashboard without affecting the original dashboard.
If the admin publishes the dashboard with the same name, then it overwrites the user’s dashboard with the same name with the ‘New’ alert icon.
Dashboards can be unpublished from the Rep(s) it has already been published to.
- Select a published dashboard
- Click on the Unpublish icon under the Publish Options dropdown
- Next, select the Rep(s) to unpublish from, then click OK
Save As Dashboard
Once a dashboard has been published to any reps, the dashboard cannot be edited. To edit a published dashboard, you can select Save As and save a copy of the published dashboard.
- Click on the Customize icon from the upper right-hand corner
- Next, select the Manage Dashboards icon
- Select a published dashboard
- Click on the Save As an icon
- Enter a dashboard name and click OK
Building Dashboards ⏯
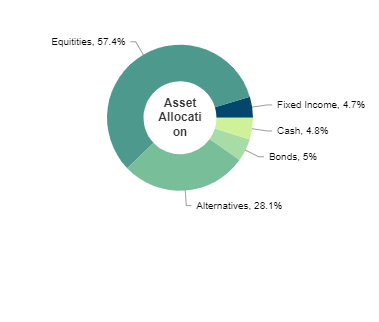
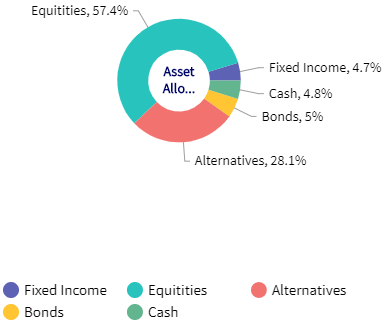
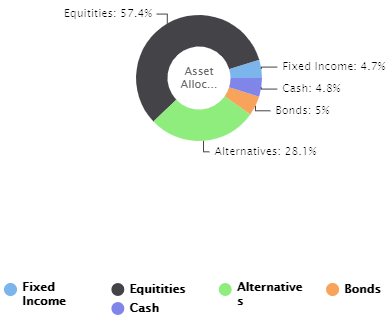
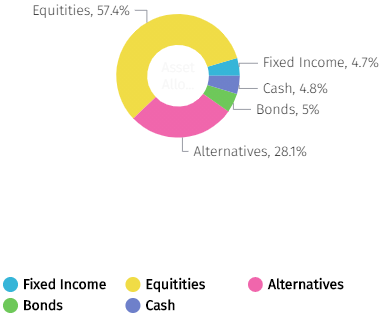
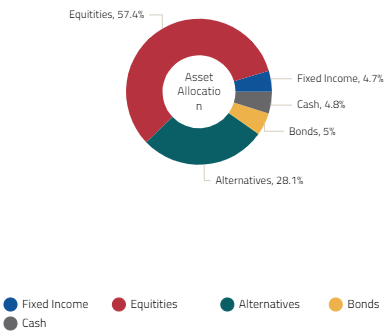
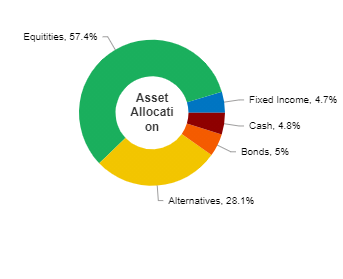
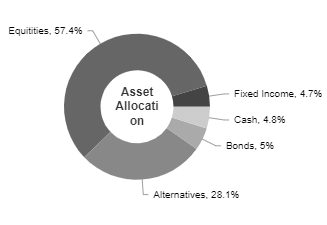
Manage Color Palette Options

Users have the ability to change the color palette for charts/graphs used within their Dashboards. The Dashboard color palette choice will apply to all Dashboards for that user, whether they created the Dashboard themselves or had a Dashboard published to them from another user.